plot_isofluxlines
- luminet.black_hole.BlackHole.plot_isofluxlines(mask_inner=True, mask_outer=True, normalize=True, order=0, ax=None, **kwargs) matplotlib.axes.Axes
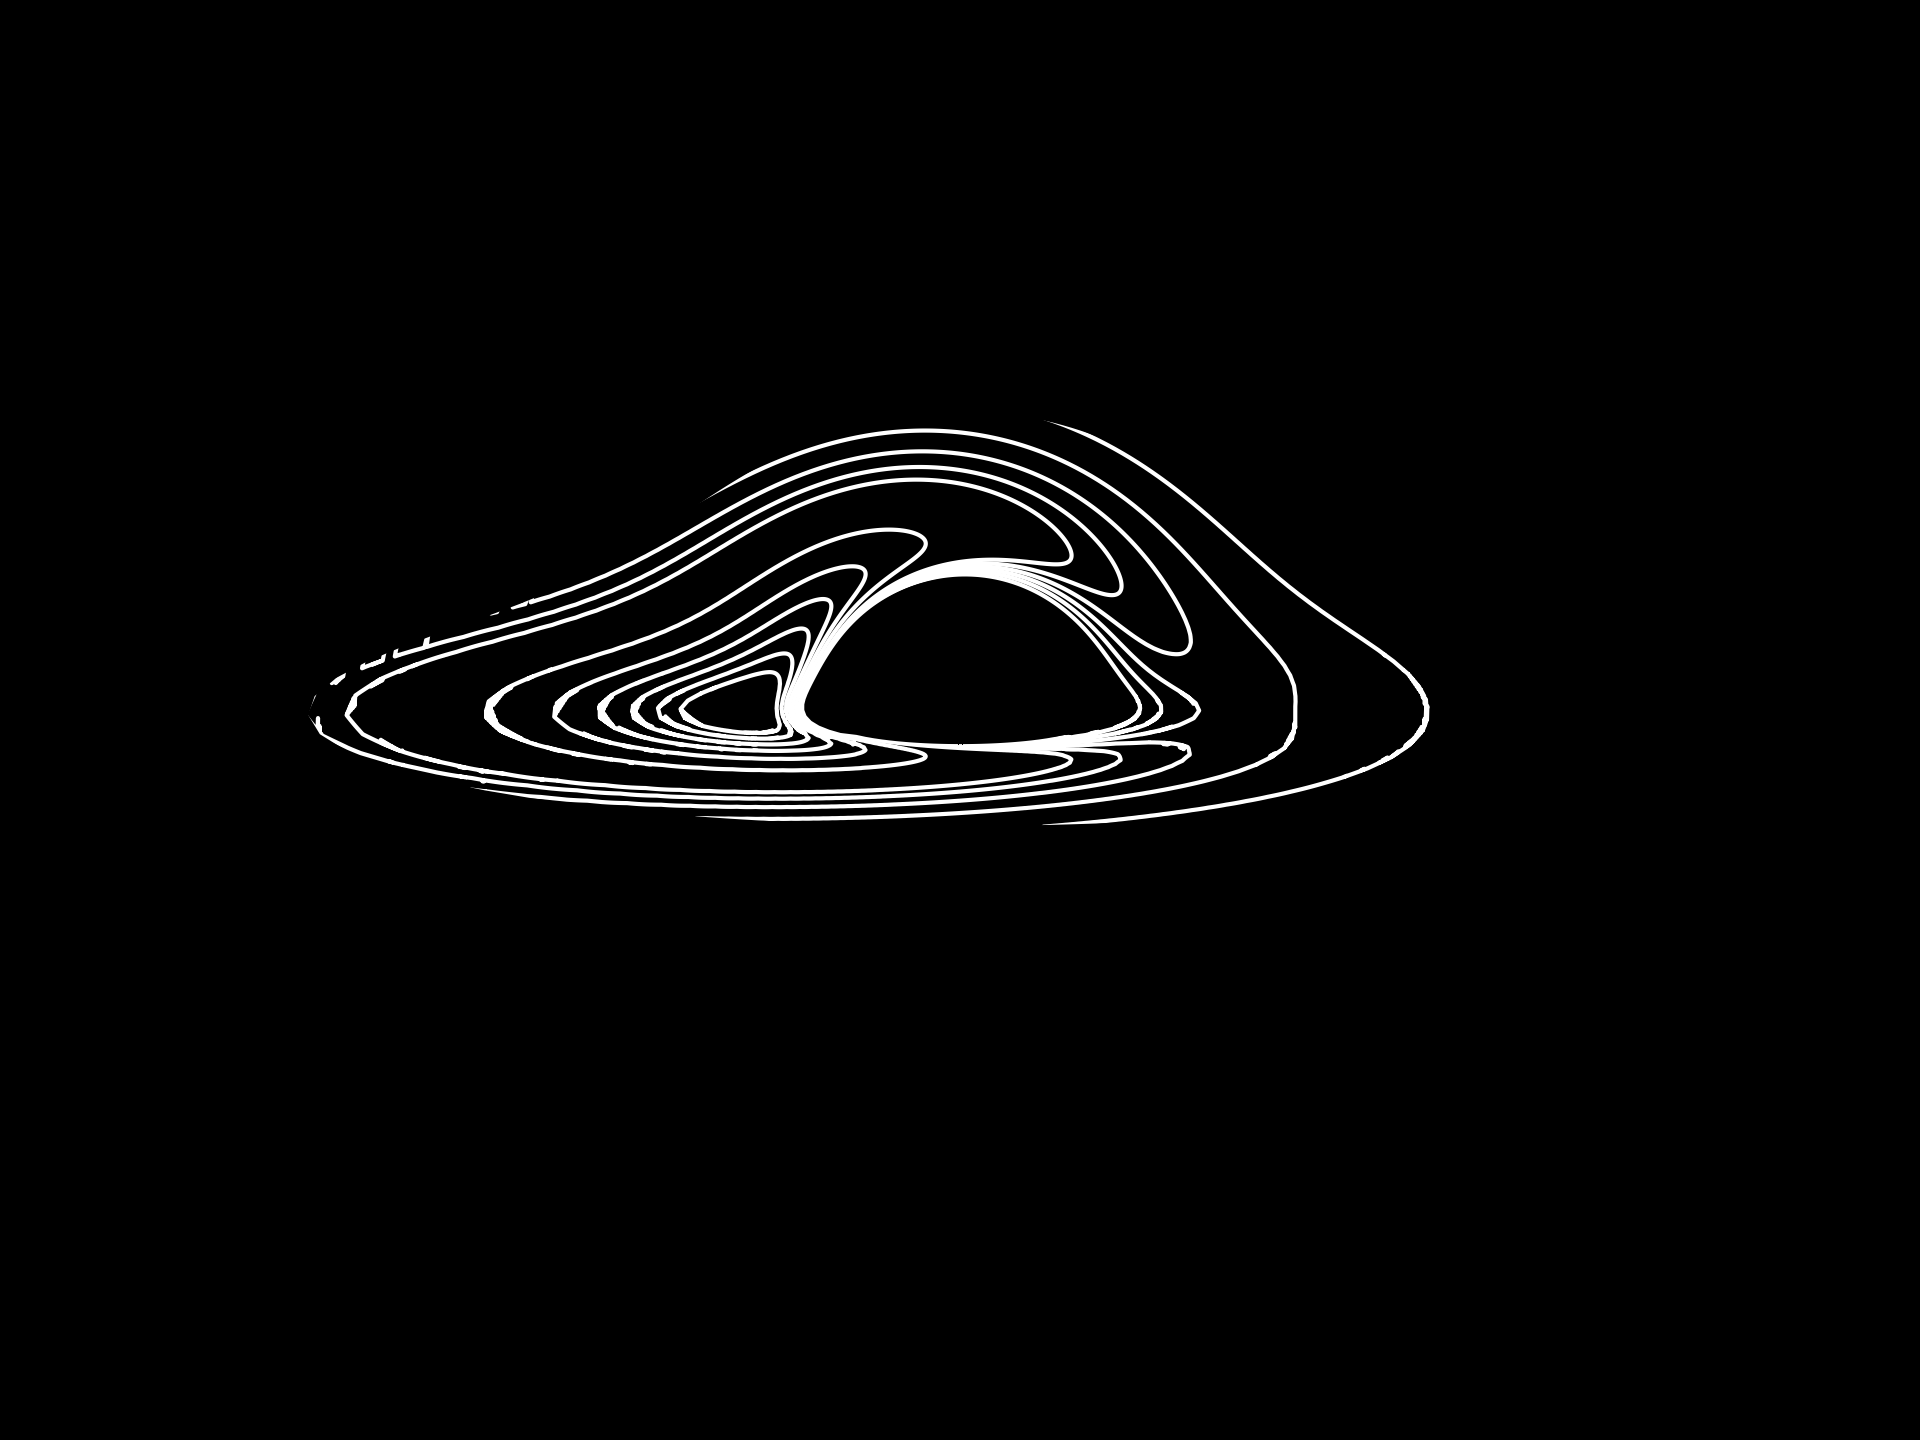
Plot lines of equal flux.
- Parameters:
normalize (bool) – Whether to normalize the fluxlines by the maximum flux or not. Defaults to True.
mask_inner (bool) – Whether to place a mask over the apparent inner edge, where the direct image produces no flux. Useful to mitigate matplotlib tricontour artifacts. Default is
Truemask_outer (bool) – Whether to place a mask over the apparent outer edge, where we are not capturing photons from. Useful to mitigate matplotlib tricontour artifacts. Default is
True.order (int) – The order of the image to plot siofluxlines for. Default is \(0\).
ax (
Axes, optional) – Axes object to plot on. Useful for when you want to plot multiple things one a single canvas.kwargs (optional) – Other keyword arguments to pass to
tricontour().
Hint
Normalizing the isofluxlines makes it easier to define specific levels.
Hint
Levels in logspace tend to produce nicer results than linearly increasing levels.
Example:
from luminet.black_hole import BlackHole

bh = BlackHole(incl=1.4, radial_resolution=200)
levels = [.05, .1, .15, .2, .25, .3, .6, .9, 1.2, 1.5, 1.8, 2.1]
ax = bh.plot_isofluxlines(colors='white', levels=levels, linewidths=1)
- Returns:
matplotlib.axes.Axes– The plotted isofluxlines.