plot_isoradials
- luminet.black_hole.BlackHole.plot_isoradials(direct_r: List[int | float], ghost_r: List[int | float] | None = None, color_by='flux', ax: matplotlib.axes.Axes | None = None, **kwargs) matplotlib.axes.Axes
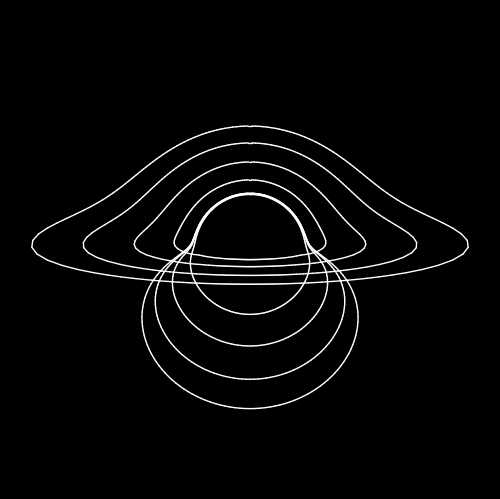
Plot multiple isoradials.
This method can be used to plot one or more isoradials. If the radii are close to each other, the isoradials will be plotted on top of each other, essentially visualizing the entire black hole.
- Parameters:
direct_r (List[int | float]) – list of radii for the direct image
ghost_r (List[int | float]) – list of radii for the ghost image
color (str) – color scheme for the isoradials. Default is ‘flux’.
kwargs (optional) – additional keyword arguments for the
luminet.isoradial.Isoradial.plot()method.ax (
Axes, optional) – Axes object to plot on. Useful for when you want to plot multiple things one a single canvas.
Example:
from luminet.black_hole import BlackHole

direct_irs = [6, 10, 15, 20]
ghost_irs = [6, 20, 50, 100]  # ghost_r can go to infinity
ax = bh.plot_isoradials(direct_irs, ghost_irs, lw=1, colors='white')
- Returns:
Axes– The plotted isoradials.